About CarBench
CarBench is the first comprehensive benchmark dedicated to large-scale 3D car aerodynamics. It evaluates state-of-the-art deep learning models on DrivAerNet++, the largest public dataset for automotive aerodynamics containing over 8,000 high-fidelity CFD simulations.
We assess models across multiple paradigms—including Neural Operators, Geometric Deep Learning, and Transformers—focusing on predictive accuracy, physical consistency, and computational efficiency.
Efficiency vs. Accuracy Frontier
Interactive visualization of the Pareto frontier.
Lower and Left is better (Lower Error, Faster Inference). Bubble size represents parameter count.
Interactive Leaderboard
| Model | Family | Params (M) | Latency (ms) | Rel L2 Error | R² Test | Details |
|---|
* Click on any row to view uncertainty intervals and detailed error metrics.
Qualitative Analysis
Surface pressure predictions on unseen test geometries. Transformer-based models (AB-UPT, Transolver) capture stagnation zones and wake regions with higher fidelity than Point-based baselines.
Side profile comparison showing pressure distribution along the roofline and underbody.
Wheel Aerodynamics: Wheels contribute up to 25% of total drag. This region is challenging due to rotation and complex geometry. Models like AB-UPT and TransolverLarge show significantly fewer artifacts on the tire surface.
Cross-Category Generalization
Evaluating how well models trained on specific car archetypes (e.g., Fastback) generalize to unseen categories (e.g., Estateback). Results show that training on larger, more diverse datasets (Fastback) yields better transfer than training on smaller sets. (Metrics for Transolver / Transolver++)
| Training Data | Test Data (Unseen) | Ratio (Train/Test) | Rel L2 Error | R² Score | Verdict |
|---|---|---|---|---|---|
| Fastbacks + Notchbacks | Estatebacks | 3.88 | 0.239 / 0.218 | 0.91 / 0.92 | Good Transfer |
| Estatebacks + Fastbacks | Notchbacks | 3.74 | 0.172 / 0.173 | 0.95 / 0.95 | Excellent |
| Fastbacks Only | Estate + Notch | 1.51 | 0.254 / 0.245 | 0.90 / 0.91 | Strong |
| Estatebacks Only | Fast + Notch | 0.15 | 0.398 / 0.419 | 0.74 / 0.72 | Poor |
| Estatebacks + Notchbacks | Fastbacks | 0.41 | 0.489 / 0.499 | 0.61 / 0.59 | Failure |
Statistical Error & Failure Analysis
Beyond average metrics, we analyze the tail of the error distribution (P95, P99). Models like PointNet suffer from massive outliers (P99 > 200 m²/s²), while AB-UPT maintains robustness even in extreme cases.
| Model | Median Rel. Error | P50 (Median) Error | P95 (Tail) Error | P99 (Extreme) Error |
|---|---|---|---|---|
| AB-UPT | 0.06 | 6.20 | 37.90 | 78.30 |
| TransolverLarge | 0.07 | 6.84 | 40.67 | 83.17 |
| Transolver++ | 0.09 | 7.99 | 44.73 | 89.25 |
| RegDGCNN | 0.10 | 9.91 | 54.15 | 111.75 |
| PointNet | 0.19 | 17.57 | 101.32 | 249.43 |
Subsampled vs. Full-Resolution Evaluation
Evaluating on point clouds (10k points) often masks true errors. Testing on the Full CFD Mesh (487k points) reveals significant performance drops, especially for older architectures.
| Model | 10k Points (Rel L2) | Full Mesh (Rel L2) | Performance Gap | Full Mesh R² |
|---|---|---|---|---|
| AB-UPT | 0.136 | 0.291 | +114% | 0.869 |
| Transolver++ | 0.156 | 0.293 | +88% | 0.867 |
| RegDGCNN | 0.205 | 0.293 | +43% | 0.866 |
| NeuralOperator | 0.324 | 0.347 | +7% | 0.813 |
| PointNet | 0.395 | 0.403 | +2% | 0.747 |
* Note: Models with very high initial error (like PointNet) show small gaps because they perform poorly at both resolutions. High-accuracy models show larger relative gaps but still achieve the best absolute performance.
Geometric Diversity Analysis
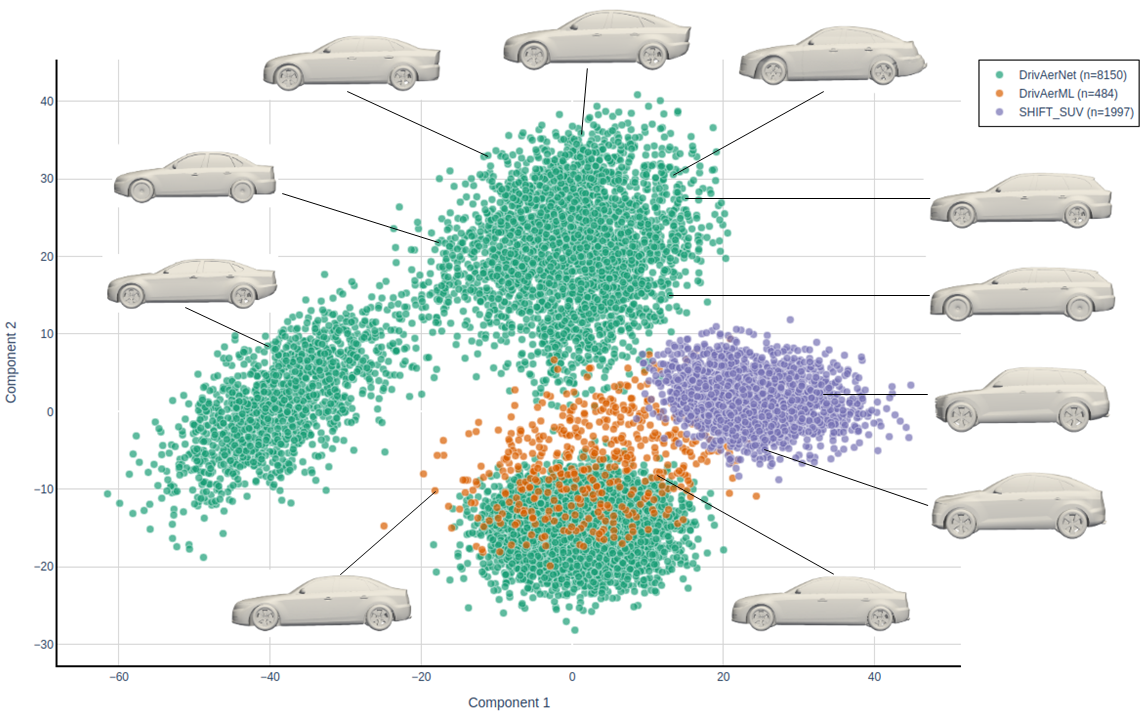
Superior Coverage of the Design Space
The Principal Component Analysis (PCA) projection above illustrates the geometric feature space covered by various automotive datasets. DrivAerNet++ (represented by the broad distribution of points) spans a significantly wider and more continuous region compared to existing datasets like DrivAerML and SHIFT-SUV.
This superior diversity is critical for training robust neural surrogates. Unlike previous benchmarks that cluster around specific vehicle types, DrivAerNet++ encompasses a comprehensive range of morphologies—including variations in fastbacks, estatebacks, and notchbacks—ensuring models generalize well to unseen, complex geometries found in real-world automotive engineering.